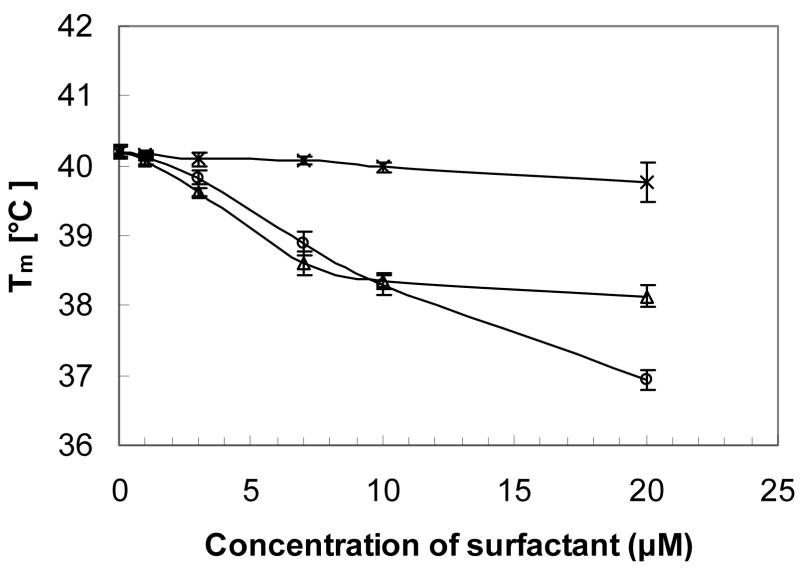
Figure 4.
Tm as a function of the increasing concentration of carbohydrate surfactants β-13a (×), β-13d (◊) or β-15b (Δ). Tm, the temperatures at midpoint of the phase transition, was determined from plots of absolute fluorescence anisotropy values as a function of temperature. All fluorescence experiments were carried out at least in triplicate.

