
Figure 2.
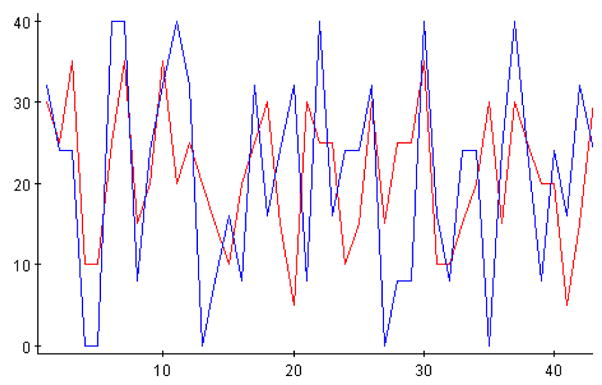
Statistically insignificant differences between the Stat 100A (Sanchez) treatment and control classes according to the beginning of the quarter Felder-Solomon questionnaire. Figure shows only the frequencies of the “a” responses to all questions from the two groups. The horizontal and vertical axes represent the index of the Felder-Solomon questions and the frequencies of the “a” responses, respectively.