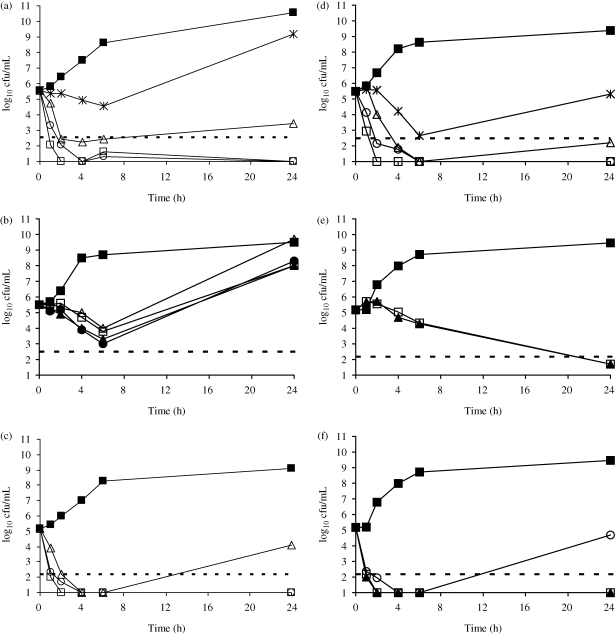
Figure 1.
Time–kill curves for P. aeruginosa ATCC 27853 and (a) FTI, (b) fosfomycin and (c) tobramycin, and for S. aureus ATCC 29213 and (d) FTI, (e) fosfomycin and (f) tobramycin. Antibiotics were tested at concentrations of 0.5 × MIC (asterisks), 1 × MIC (open triangles), 2 × MIC (open circles), 4 × MIC (open squares), 8 × MIC (filled triangles) and 16 × MIC (filled circles). Closed squares, no drug; broken line, bactericidal line.

