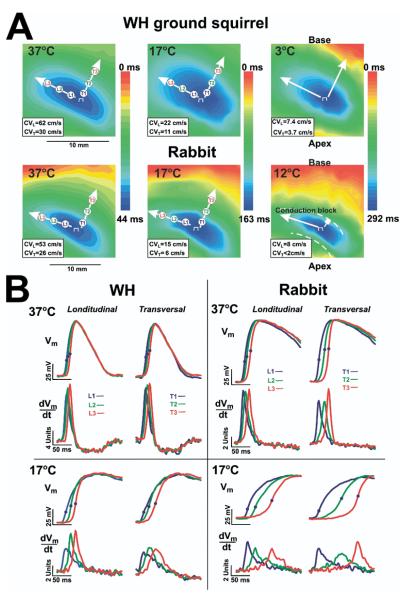
Figure 1.
The effect of hypothermia on the left ventricular activation pattern. A: Optical maps during epicardial pacing of the winter-hibernating (WH) ground squirrel and rabbit heart shown at various temperatures during pacing (400 ms at 37°C, 1,000 ms at 17°C, 2,000 ms at 12°C, and 4,000 at 3°C, respectively). Epicardial pacing at the center of the left ventricle produced an ellipsoidal spread of propagation with fast conduction parallel to the fiber axis (longitudinal conduction) and slow conduction perpendicular to the fiber axis (transverse conduction). Arrows show the directions of conduction velocity measurements longitudinal (CVL) and transversal (CVT). The values of corresponding CVs are presented at the right bottom corner of each map. B: Superimposed upstrokes of optical APs and their derivatives corresponding to recording sites in longitudinal direction L1, L2, and L3 and transversal T1, T2, and T3 in maps in panel A. Optical APs were normalized to range from -77 to +12 mV (WH) and from -85 to +15 mV (rabbit) 37 °C, range from -65 to 17 mV (WH) and -61 to +5 mV (rabbit) at 17°C using previously published microelectrode data.5

