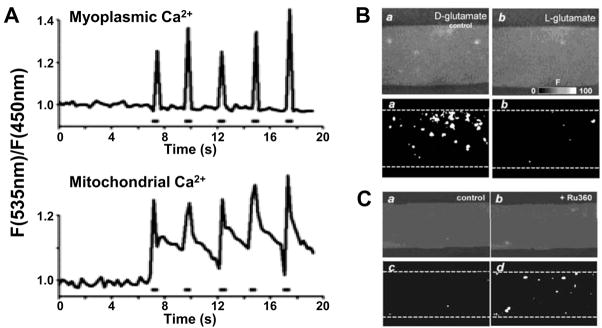
Figure 3. Mitochondrial calcium uptake and calcium spark suppression in skeletal muscle.
A. Tibialis anterior muscles expressing myoplasmic and mitochondrial calcium (Ca2+)-sensitive cameleons were imaged in vivo with two-photon microscopy. Time course of myoplasmic (top) and mitochondrial (bottom) Ca2+ transients (fluorescence, F) elicited during high frequency stimulation (0.5 s, 50 Hz stimulation train). (Reprinted from Rudolf R, Mongillo M, Magalhaes PJ, Pozzan T. In vivo monitoring of Ca2+ uptake into mitochondria of mouse skeletal muscle during contraction. J Cell Biol. 2004;166(4):527–36. Copyright © 2004 Rockefeller University Press. Used with permission). B. (Upper) Confocal images obtained for permeabilized extensor digitorum longus (EDL) muscle fibers perfused with L-glutamate (right), a substrate for the TCA cycle, or D-glutamate (left), which is not a substrate for the tricarboxylic acid (TCA) cycle. (Lower) Corresponding cumulative binary images for regions with F/F0 > 3 S.D. Data reproduced with permission from J Physiol 2003;547(Pt 2):453–62 (16). C. (Upper) Confocal images obtained for a permeabilized EDL muscle fiber perfused with L-glutamate before (left) and after block of mitochondrial Ca2+ uptake with 20 μM Ru360 (right). (Lower) Corresponding cumulative binary images for regions with F/F0 > 3 S.D. (Reprinted from Isaeva EV, Shirokova N. Metabolic regulation of Ca2+ release in permeabilized mammalian skeletal muscle fibres. J Physiol. 2003;547(Pt 2):453–62. Copyright © 2003 Blackwell Publishing. Used with permission.)

