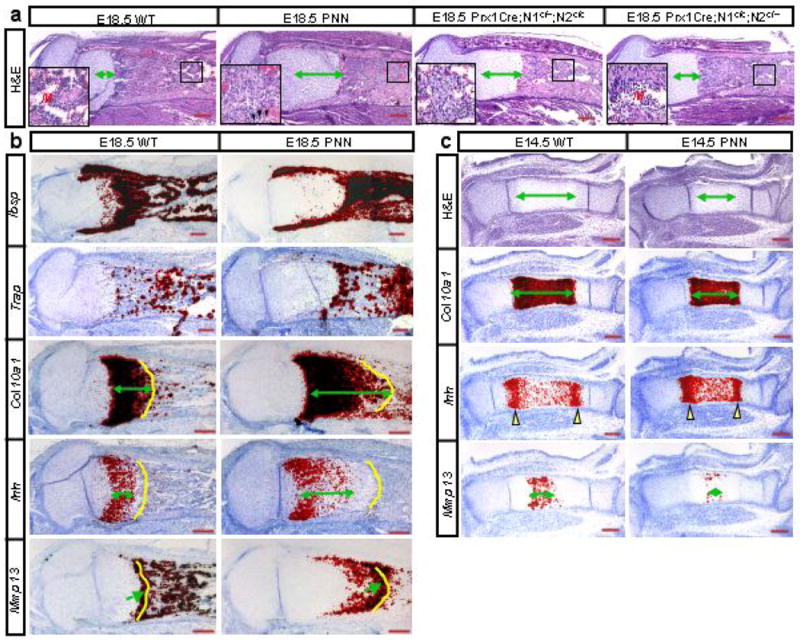
Figure 3.

Molecular and histological analyses in PNN and wild type (WT) embryos. (a) H&E staining of medial longitudinal sections through the tibia of E18.5 embryos with various combinations of Notch1 (N1) and Notch2 (N2) alleles. Insets: higher magnification of boxed regions: M: marrow; arrowheads: occasional myeloid cells. Double-headed arrows: hypertrophic zone. (b) In situ hybridization on adjacent longitudinal sections through the tibia from E18.5 wild type (WT) versus PNN littermates. Double-headed arrows denote length of expression domain; yellow contours demarcate chondro-osseous junction; arrows indicate last low of hypertrophic chondrocytes. (c) H&E staining and in situ hybridization of adjacent medial longitudinal sections through the tibia of E14.5 littermates. Double-headed arrows: lengths of hypertrophic zones or expression domains. Yellow arrowheads denote major expression domains of Ihh.
