
Figure 1.
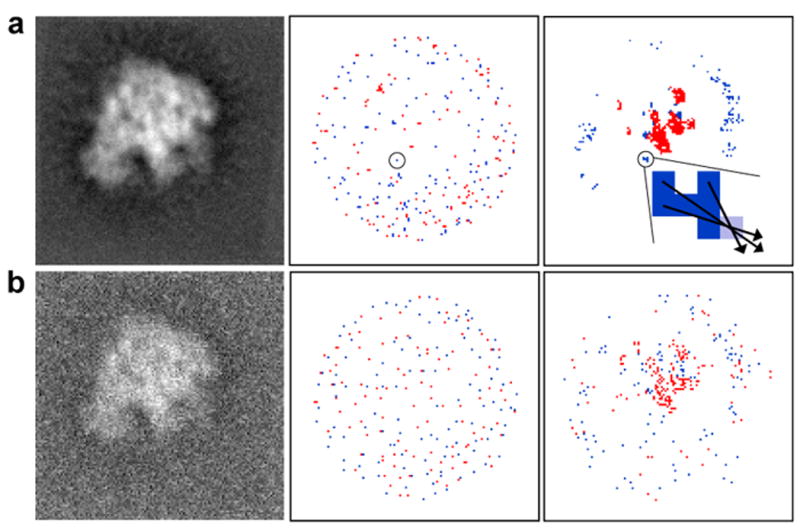
Example demonstrating the feature extraction approach applied to a 50S ribosome projection. The first column shows simulated images that were computed (a) at SNR 5:1, and (b) at SNR 1:1. The second column shows the set, E, of local extreme values, where maximum values are colored red and minimum values are colored blue. The third column shows the set, S, of significant values (red for high densities and blue for low densities). Even with the increased level of noise shown in (b), the members of the two sets, S, (top rightmost and bottom rightmost images) are distributed at similar locations. The zoomed region in the top right panel shows six pixels from the set S, colored in dark blue, and the nearest pixel from the set E, colored in light blue. Three arrows are shown as examples of the directions that are defined by the vectors, F, from elements in S to elements in E.