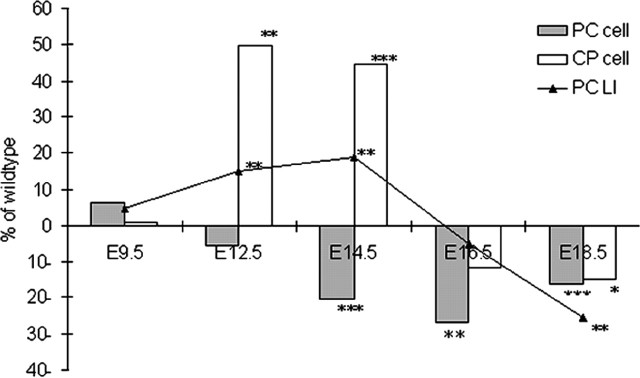
Figure 9.
Summary of the changes in cellular dynamics in tlx-deficient animals as a percentage of wild-type animals in caudal regions. The percentage of change of mutant from wild-type values is shown. The gray bars represent the PC population, the white bars represent the postmitotic cell compartment, and the black line represents the changes in the LI (the average LI for the VZ and SVZ). *p < 0.05; **p < 0.01; ***p < 0.001.

