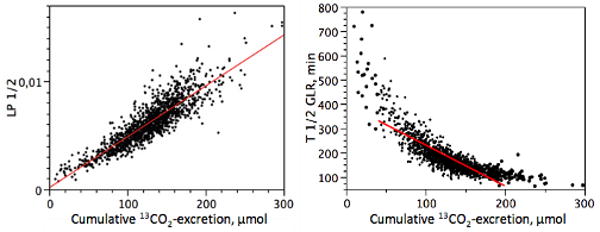
Fig. 3.

An excellent linear correlation was observed between LP½ and cumulative 4 h-13C-exhalation (R2=0.774, p<0.00001) (A). LP½ is the linear predictor which is calculated as weighted sums of 13CO2 production rates (derived from 3 breath samples, only) and is defined as the reciprocal of T½GLR. Accordingly, an identically tight, yet exponential correlation was observed between cumulative 4 h-13C-exhalation and T½GLR (B). For the vast majority of breath test data (all tests with cumulative 13CO2-excretion between 40 and 200 μmol, n=1209, equivalent to 94.5% of all tests) a highly significant linear correlation could also be established (solid line, R2=0.711, p<0.00001). Only the extremes with very low (n=27) or high (n=43) cumulative 13CO2-excretion markedly deviate from this approximately linear part of the curve.
