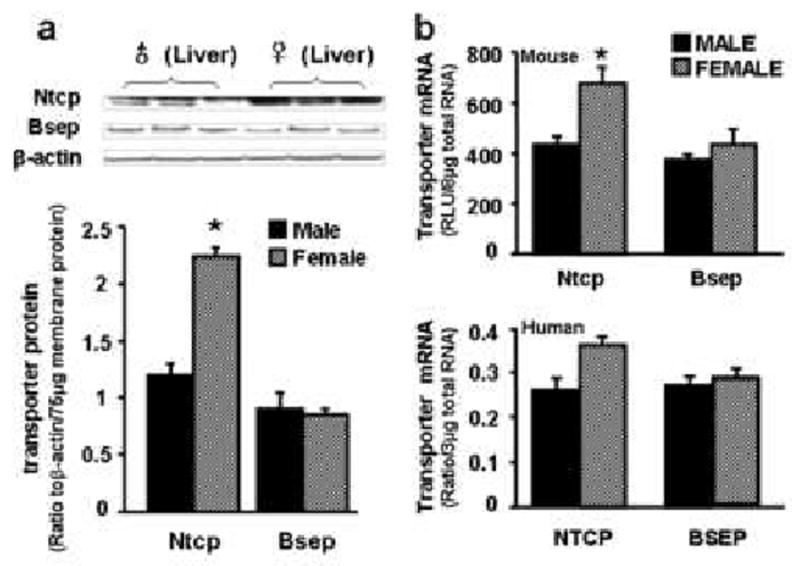
Fig. 1. mRNA and protein expression of Ntcp/NTCP and Bsep/BSEP in mouse and human livers.

a) Protein levels of Ntcp and Bsep in male and female mouse livers. In the top panel, protein levels of Ntcp and Bsep in liver plasma membranes were analyzed by western blotting. In the bottom panel, protein levels of each transporter in male and female mouse livers are expressed as ratio of Ntcp (or Bsep) to β-actin protein levels per 75μg total membrane protein. Data are presented as mean ± S.E.M. Asterisks indicate statistically significant differences between male and female mice (p<0.05). b) mRNA expression of Ntcp/NTCP and Bsep/BSEP in mouse and human livers. Total RNA from both male and female C57BL/6 mice (n = 10/gender) and human livers (30 male Caucasians and 20 female Caucasians) was analyzed by the bDNA assay for mRNA expression of each transporter. Mouse data (on the top) are reported as relative light unit (RLU) per 10 μg of total RNA. Human data (on the bottom) are reported as ratio of NTCP (or BSEP) to GAPDH mRNA expression per 3 μg of total RNA. Both human and mouse data are presented as mean ± S.E.M. Asterisks indicate statistically significant differences between male and female mice (p<0.05).
