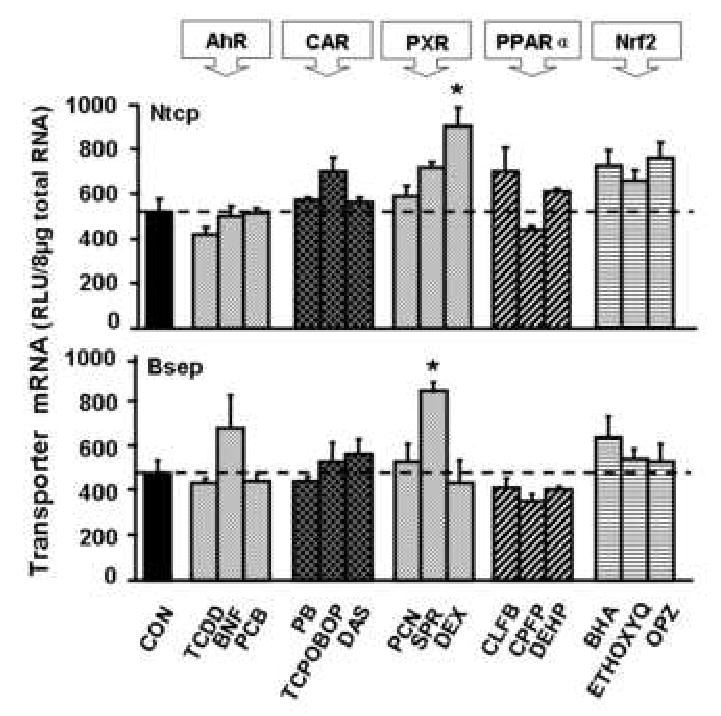
Fig. 4. mRNA expression of Ntcp and Bsep in adult male C57BL/6 mouse liver after administration of prototypical phase-I and phase-II drug-metabolizing enzyme inducers.

Mice were administrated once daily for 4 days with each of microsomal enzyme inducers (n=5/group) as detailed in Materials and methods. Total RNA from five chemically treated male livers was analyzed by the bDNA assay. All data were expressed as mean ± S.E.M. for five mice in each group, except for control groups, which were combined from the four individual control groups after it was determined that they were not statistically different. Asterisk indicates statistically significant difference between treated and control mice (p < 0.05).
