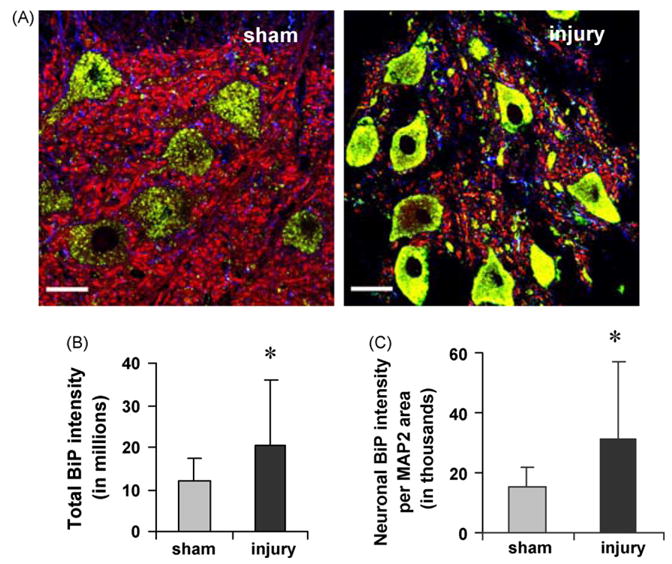
Fig. 2.

BiP immunostaining increases in DRG neurons after injury (A). Using triple label immunosfluorescent confocal microscopy, BiP staining (green) is more prominent in injured DRG neurons (MAP2; red). Nuclei are shown in blue. Red and green co-localize to yellow. Scale is 30 μm for both images. Quantification of total BiP-integrated pixel intensity (B), and integrated pixel intensity of BiP colocalizing with MAP2, normalized to MAP2 area (C) show increased BiP expression. Data are presented as average ±standard deviation, with significant increases (*) over sham.
