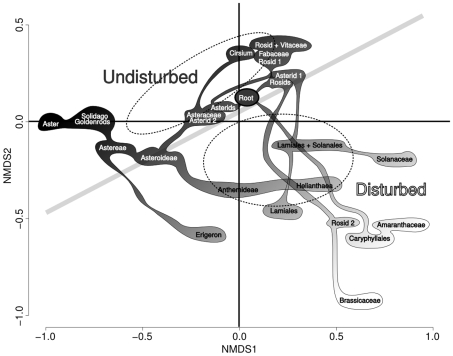
Figure 3. Non-metric multidimensional scaling scores for all phylogenetic nodes with reference to habitat occurrence tendency.
Ordination plot for the phylogenetic ordination shown in figure 2b but with plot points removed and phylogenetic node vectors displayed. For clarity, only important or non-redundant nodes are displayed. Filled bubbles are a rough representation of the branching structure of the nodes from one another. Dark filling represents more association with undisturbed plots whereas lighter filling represents more association with disturbed plots. Dotted ellipses represent the centroids and 1 SD area as a reference for where disturbed and undisturbed plots fall on the diagram. Nodes which are referred to can be seen on figure 1.

