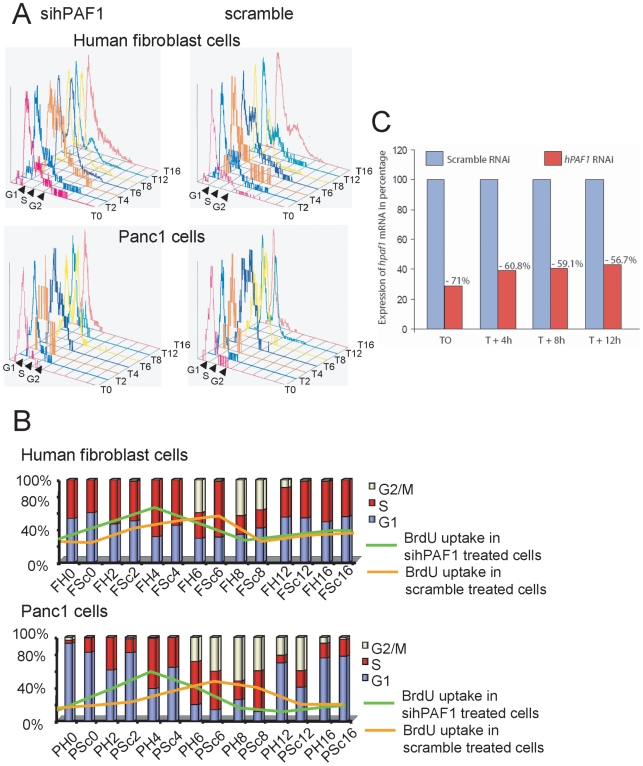
Figure 4. hPaf1 regulates the cell cycle.
A) Panc1 and human normal fibroblast cells were transfected either using a hPaf1 or scramble siRNA, and synchronized at the G1/S boundary by double thymidine block. The cell cycle progression was measured by propidium iodide staining and BrdU uptake every 2 h for 24 h. The BrdU was added one hour before each time point. B) Bar diagram summarizing the results of the cell-cycle kinetic for both human fibroblast and Panc1 cells. FH: fibroblast cells knock down for hPaf1, FSc: fibroblast cells transfected with the scramble siRNA, PH: Panc1 cells knock down for hPaf1, PSc: Panc1 cells transfected with the scramble siRNA. The bars represent the percentage of cells in each phase of the cell-cycle measured by propidium iodide, and the lines represent the percentage of BrdU uptake for each time point. C) Suppression of hPaf1 expression by the fibroblast cells after transfection with siRNA oligonucleotide was measured by one-step real time RT-PCR using a TaqMan probe following the absolute standard curve method. Standard curves were established using hPaf1 and GAPDH mimics. Sequences and conditions used in this experiment are available upon request.

