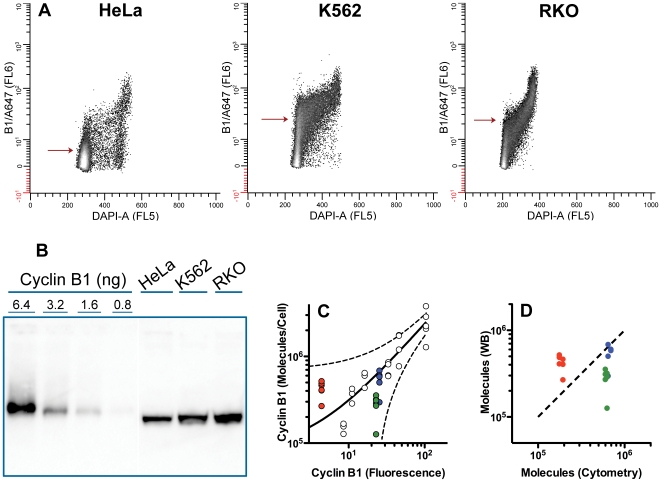
Figure 7. Test cell lines.
Samples of HeLa, K562, and RKO were fixed with methanol then stained for cyclin B1 with GNS1-AlexaFluor 647 (A647) and DNA (DAPI). Part of the sample was also lysed and subject to Western blot analysis in the same manner as the standard lysates described in Figure 5. (A) cytometry data are displayed as in Figure 5. Arrows indicate the mean cyclin B1 related fluorescence. (B) Western blot prepared as in Figure 5. The lanes for the test cell lines were not loaded with equal cell numbers; loading was adjusted to obtain bands with intensities within the range of the cyclin B1 standards. Protein concentration was equalized with trypsin inhibitor. (C) co-plot of the standard curve and the test samples using the measured values for cyclin B1 molecules obtained by Western analysis for the test samples. HeLa = red circles; K562 = blue circles; RKO = green circles. The 95% prediction band for the standard curve is plotted (dashed lines). (D) Molecules were determined by Western blotting (Y axis) and by cytometry using the standard curve (X axis). The dashed line is a one-to-one correlation. Color coding is as in C.

