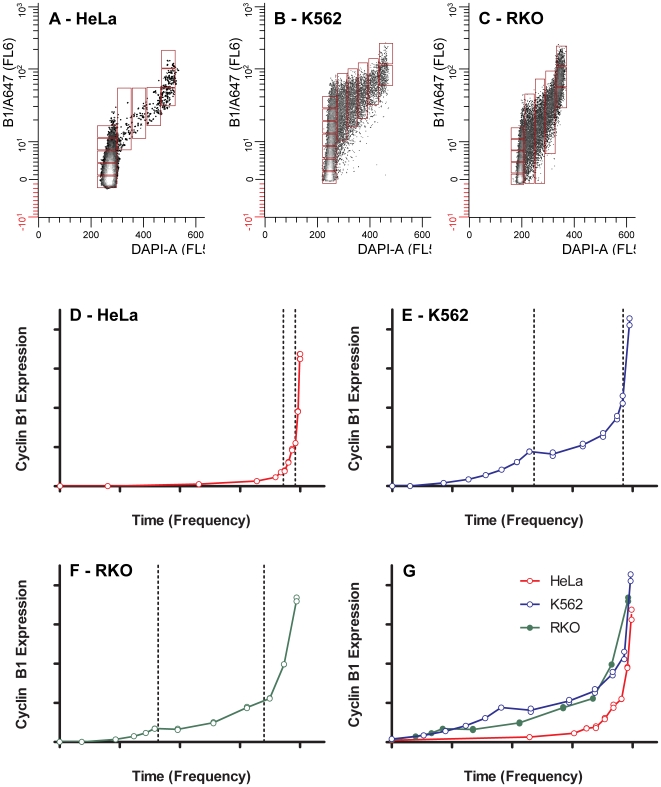
Figure 8. Cell cycle expression of cyclin B1.
The cytometric data for HeLa, K562, and RKO cells (Figure 7) were gated to exclude endoreduplicated or binucleate cycling cells (4C  8C); mitotic cells after metaphase, and outliers. The purpose was to expose only the cells distributed about the two dimensional center as a function of DNA content. These data represent the most common cycling cell in the population. Arbitrary regions were set, moving through the data from early G1 through late G2+M (A–C). The mean cyclin B1 levels from each region are plotted as a function of the cell frequency in the region (D–F). The frequency data were renormalized from the first non-zero cyclin B1 point and plotted to compare the committed part of the cell cycle (cyclin B1 is detectable) for each cell line (G). In A-G, the X axis scale is 0–1, and the Y axis scale is 0–4×10⁶.

