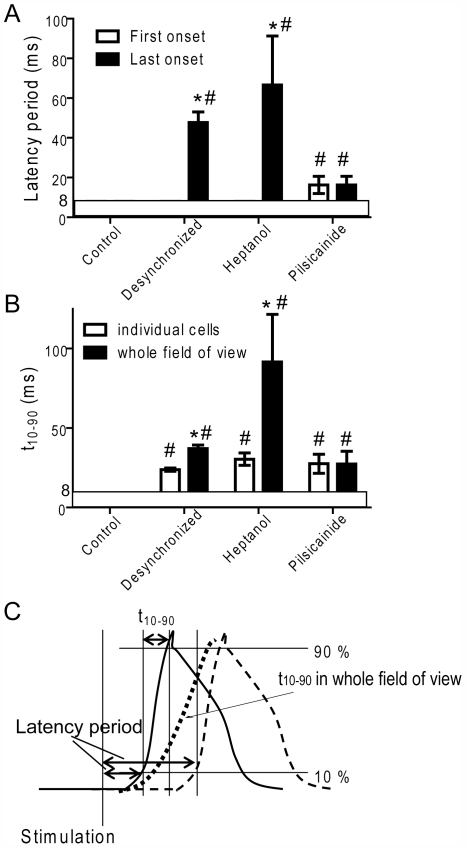
Figure 6. Latency (A) and the rate of rise (B) of the action potential under various conditions.
Control: control muscles (n = 22); Desynch: muscles showing visually discernable desynchronization in Ca2+ transients (>40 ms) after the pacing protocol (n = 6); Heptanol: with 2 mM heptanol (n = 5); Pilsicainide: with 40 µM pilsicainide, muscles were stimulated locally (n = 4). A. Action potential latencies in cells with the first (open column) and last onsets (filled column) in the field of view were determined. *significant difference from the first onset. #significant difference from control. B. Rates of rise of the action potentials (t10–90) in randomly chosen individual cells (mean of 10 cells for each preparation were averaged for n preparations, open column) and in the whole field of view (filled column). *significant difference from individual cells. #significant difference from control. Data are mean±S.E.M. P<0.05. Note that the responses faster than ∼8 ms were not distinguishable. C. A schematic illustration of determinations of the action potential latency and the rate of rise of the action potential.

