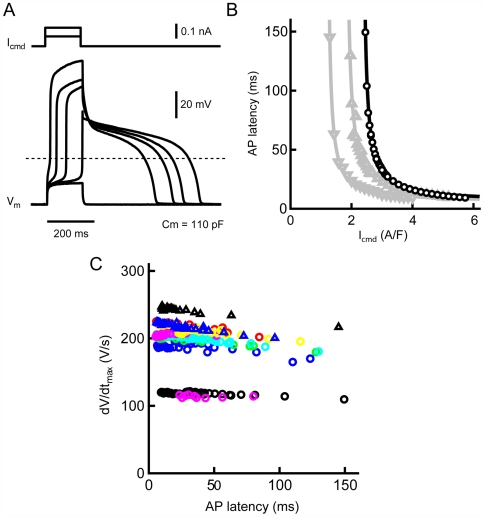
Figure 7. Effects of reduced depolarizing currents on action potential onset in isolated single myocytes.
A. Typical traces of action potentials (lower records) evoked by a small command current (upper traces). B. Relationship between action potential latency and command current amplitude. Different symbols correspond to different myocytes. C. Relationship between the rate of rise of action potential (dV/dtmax) and action potential latency. Different symbol correspond to different myocytes.

