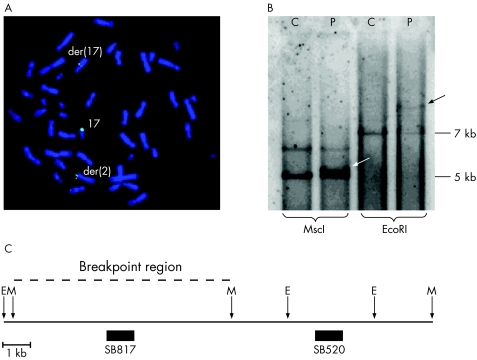
Figure 2 The breakpoint region at 17q. (A) FISH analysis showing the breakpoint‐spanning bacterial artificial chromosome (BAC) clone RP11‐7D6. (B) Southern blot hybridisation using probe SB817 and the restriction enzymes MscI and EcoRI. With MscI digests, the 5 kb normal fragment and a larger band representing the junction fragment (white arrow) are detected in the patient. With EcoRI digests, besides the 7 kb normal fragment, the patient has a larger fragment (black arrow). (C) The physical map of the breakpoint region. The 12 kb interval is within the 15 kb overlapping region of the spanning BAC (fig 2A) and the fosmid clones. The breakpoint region (dashed line) is mapped between the two MscI restriction sites (chromosome position 66 485 382–66 491 517). The vertical arrows show the MscI (M) and EcoRI (E) restriction sites. The filled boxes represent the two hybridisation probes SB817 and SB520. C, control; P, patient.

An official website of the United States government
Here's how you know
Official websites use .gov
A
.gov website belongs to an official
government organization in the United States.
Secure .gov websites use HTTPS
A lock (
) or https:// means you've safely
connected to the .gov website. Share sensitive
information only on official, secure websites.
