
Figure 3.
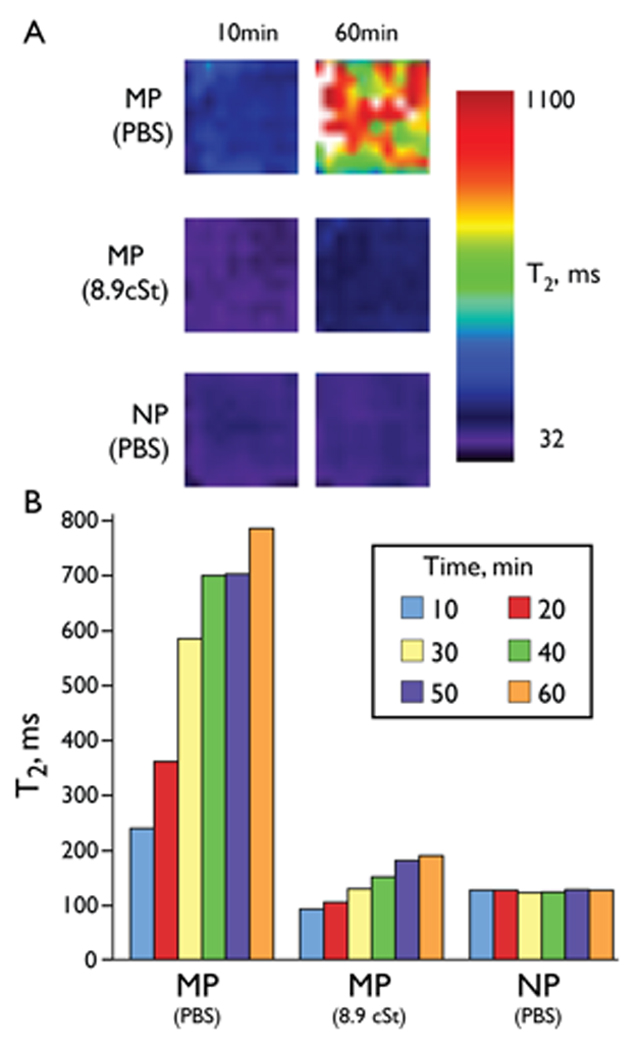
Magnetic field induced magnetic microparticle aggregation at 4.7 T. (A) T2 maps of solutions of MPs and NPs at 10 minutes and 60 minutes in a magnetic field (4.7 T, 25 °C). (B) T2 values of wells shown in (A) at 10-min intervals. A time dependent increase in the T2 occurred for the MP but not for the NP. With a viscosity of 8.9 cSt, achieved by adding Triton X-100, a smaller increase in T2 occurred. T2 values are means for the well.