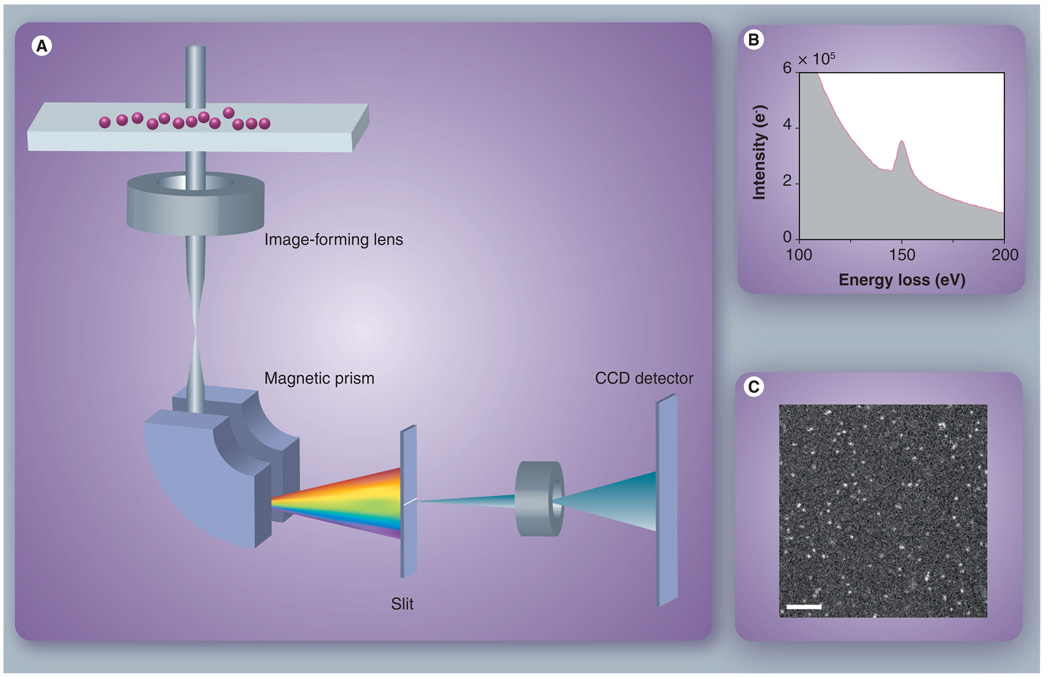
Figure 4. Quantitative energy-filtered transmission electron microscopic imaging of dendrimer nanoparticles.
(A) Principle of energy-filtered transmission electron microscopy (EFTEM) image formation. A broad electron beam illuminates a specimen of nanoparticles deposited onto an ultra-thin carbon substrate, exciting inner-shell electrons of specific atoms. A magnetic prism disperses the transmitted electrons according to energy loss, and a slit selects those electrons of a particular energy loss range. An energy-filtered image is formed at the CCD detector plane by lenses after the slit. (B) Energy-loss spectrum around gadolinium (Gd) core-loss edge obtained from a thick layer of Gd-G7 dendrimers. (C) Example EFTEM image of Gd distributions in dendrimer nanoparticles. Scale bar is 100 nm.

