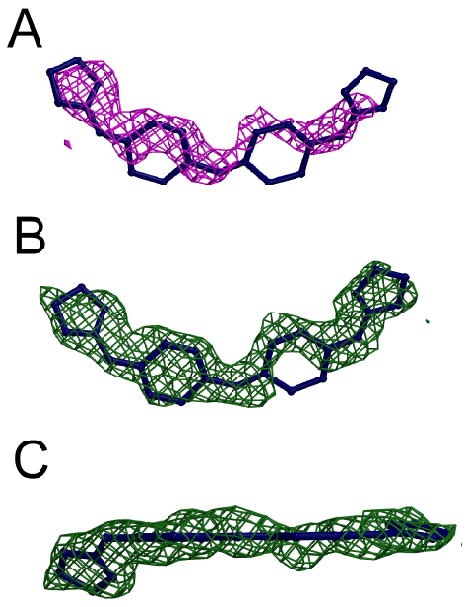
Figure 5.

(A) Initial Fo-Fc map of CD27 density contoured at 2.5 σ shown in a magenta cage rendering superimposed on the final CD27 model. (B) Final 2Fo-Fc map of CD27 density contoured at 1 σ shown in green cage rendering and the final CD27 model superimposed in blue. The view in (C) is rotated ∼90° from that shown in (B).
