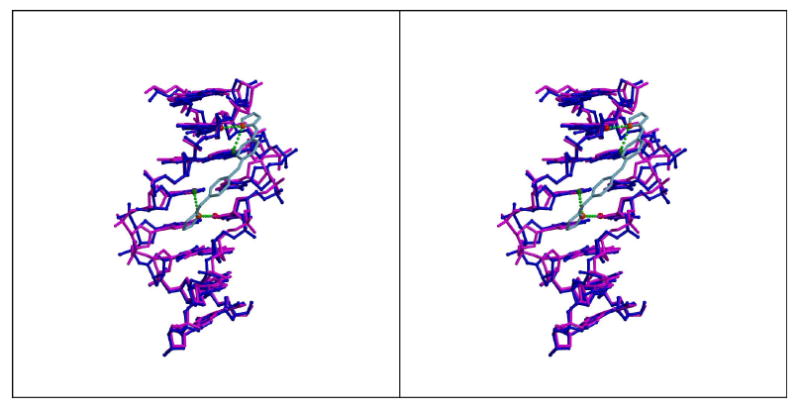
Figure 7.

(A) Stereodiagram of 5′-AATT DNA in the presence (blue) and absence (magenta) of CD27 (sky blue) bound to DNA. Final models were superimposed (rmsd = 0.6 Å) using CCP4 based on all atoms within the 8 base pairs. Hydrogen bonds between DNA and CD27 are shown in light green dashed lines. N3 atoms of A5 and A11 shown in green, O2 atoms of T7 and T13 shown in red, and N2 and N4 of CD27 in orange.
