
Fig. 2.
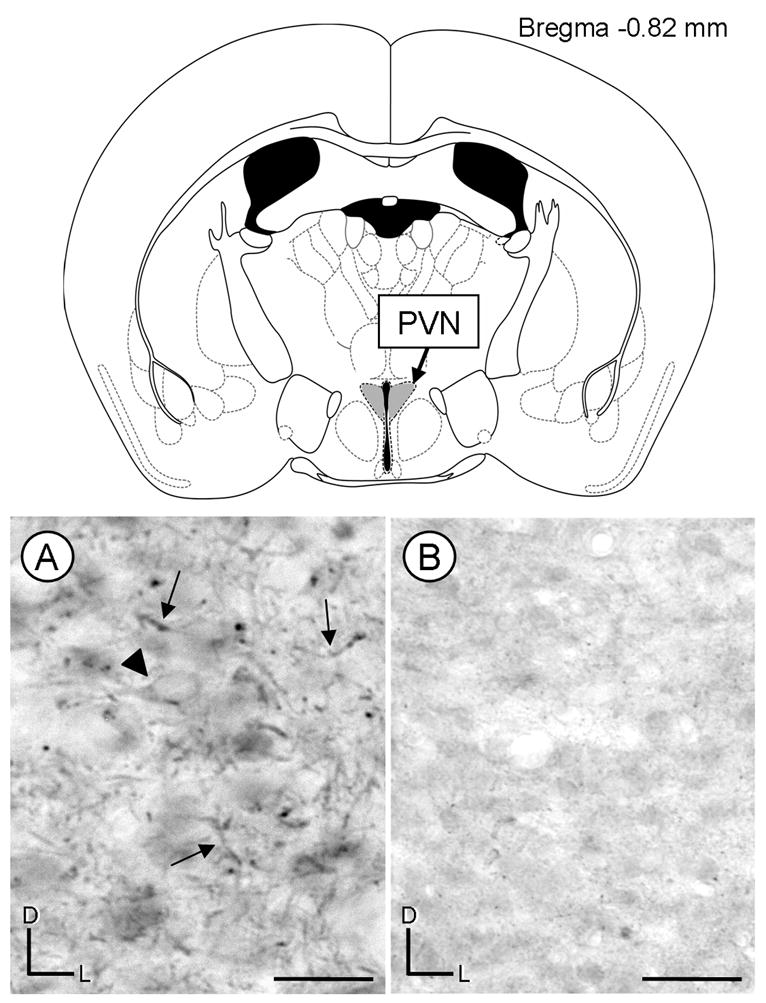
Light micrographs of coronal sections showing immunoperoxidase labeling for AT2 receptors in the paraventricular nucleus (PVN). A coronal diagram from the mouse brain atlas (Paxinos and Franklin, 2001) indicates the level and region (shaded in gray) where tissue was analyzed. A, The peroxidase reaction product is seen mainly in processes in the PVN (arrows). The arrow head is pointing to a soma with diffuse AT2 receptor peroxidase immunoreactivity. B, A reduction of immunoreactivity is observed in a coronal section that was processed using an AT2 receptor antiserum preadsorbed with the antigenic peptide. D, dorsal; L, lateral; scale bar=10 μm.