
Fig. 10.
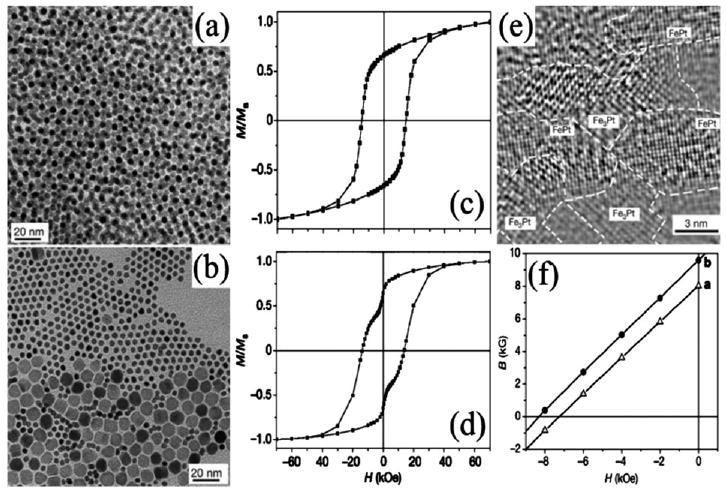
TEM images of (a) randomly occupied 4 nm/4 nm FePt/Fe3O4 array and (b) phase segregated 4 nm/12 nm FePt/Fe3O4. Corresponding hysteresis loops (c) and (d) from the binary arrays of (a) and (b) after annealing. TEM image (e) of the annealed composite from (a). Second-quadrant B–H curves of (e) (dot) and annealed 4 nm FePt array (triangle). Reproduced from ref. 44 with permission from Nature Publishing Group.