
Fig. 8.
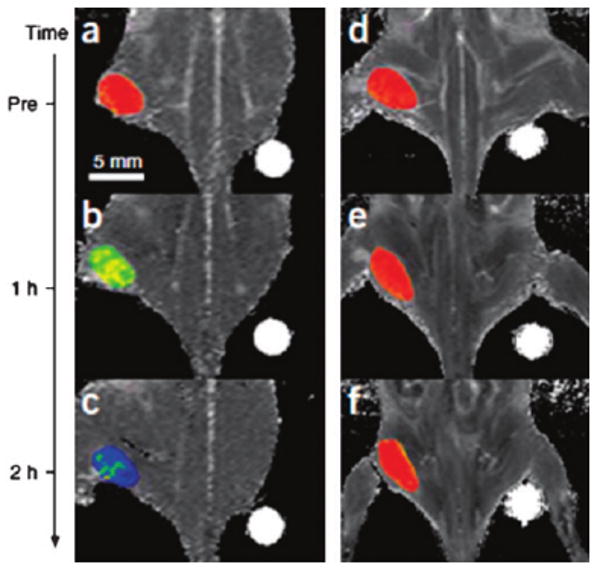
Color maps of T2-weighted MR images of a mouse implanted with the cancer cell line NIH3T6.7 at different time points after injection of MnFe2O4–Herceptin (a–c) and Fe3O4–Herceptin (d–f) conjugates. Adapted from ref. 37 with permission from Nature Publishing Group.