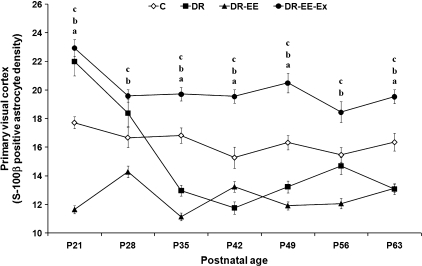
Fig. 3.
Comparison of average measurements between DR, DR-EE, DR-EE-Ex and control (C) groups at each of the ages considered. Horizontal axis shows the age of the animals. Vertical axis shows S-100β-positive astrocyte density per 62 500 µm2 of primary visual cortex (mean ± SEM). (a) C vs. DR significance; (b) C vs. DR-EE significance; (c) C vs. DR-EE-Ex significance (P ≤ 0.05) (one-way anovatest with posthoc correction). P, postnatal day.

