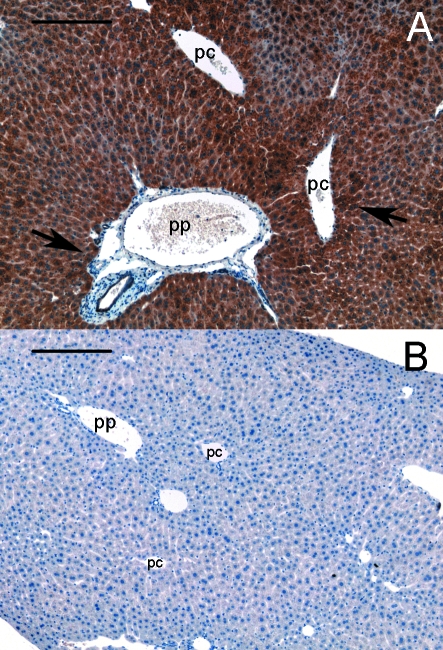
Fig. 4.
Distribution of GHR in the liver parenchyma. (A) A strong expression is shown throughout liver parenchyma with an increase in the vicinity of periportal (pp) and pericentral (pc) vessels (arrows). Midzonal regions seemed to have a slightly reduced concentration. (B) No staining is detected in the corresponding negative control section. Nuclei, stained with hematoxylin are shown in blue. Bar represents 200 µm.

