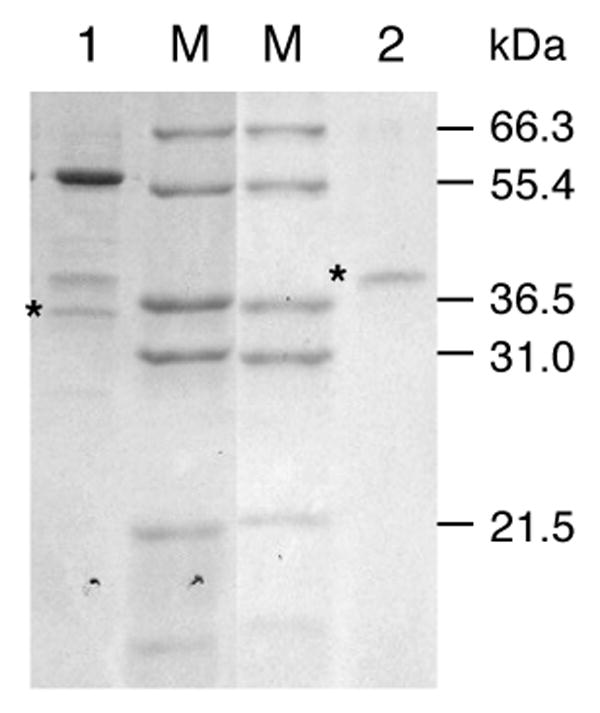
Figure 2. A composite SDS-PAGE gel showing purified isoeugenol and eugenol synthases from C. breweri petals.

Lane 1, An aliquot of the fraction with peak IGS and EGS activities from Hitrap-Q column #1 (aliquot contains 0.94 pkatal IGS activity). Lane 2, An aliquot of the fraction with peak EGS activity from Hitrap-Q column #2 (0.81 pkatal EGS activity). M, marker lanes (molecular weights indicated on the right). The gels were stained with Coomassie Blue after SDS-PAGE electrophoresis. The bands corresponding to CbEGS1/CbIGS1 (lane 1) and CbEGS2 (lane 2) are marked with asterisks.
