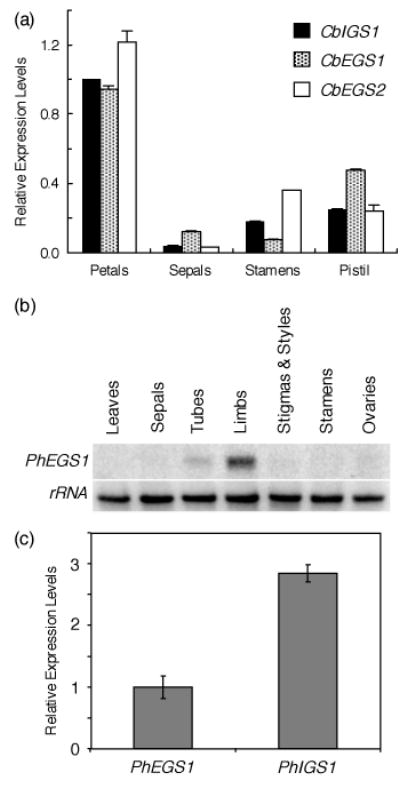
Figure 4. Detection of CbIGS1, CbEGS1, CbEGS2, PhIGS1, and PhEGS1 transcripts in different organs by qRT-PCR and northern blot.

(a) CbIGS1, CbEGS1, and CbEGS2 transcript levels from different floral organs at 1 day pre-anthesis (when mRNA levels of these genes are highest). Each graph represents the average of three replications for two independent experiments using two biological samples. Bars indicate SE.
(b) Tissue specificity of PhEGS1 mRNA. Shown is a representative RNA gel blot of total RNA (5 μg per lane), isolated from leaves and different organs of 2-day-old petunia flowers, probed with PhEGS1 (top). The blot was rehybridized with an 18S rDNA probe (bottom) to ascertain equal loading of RNA.
(c) The relative PhIGS1 and PhEGS1 mRNA levels in corollas of 2-day-old petunia flowers as determined by qRT-PCR. PhEGS1 expression was set as 1. Bars indicate SE.
