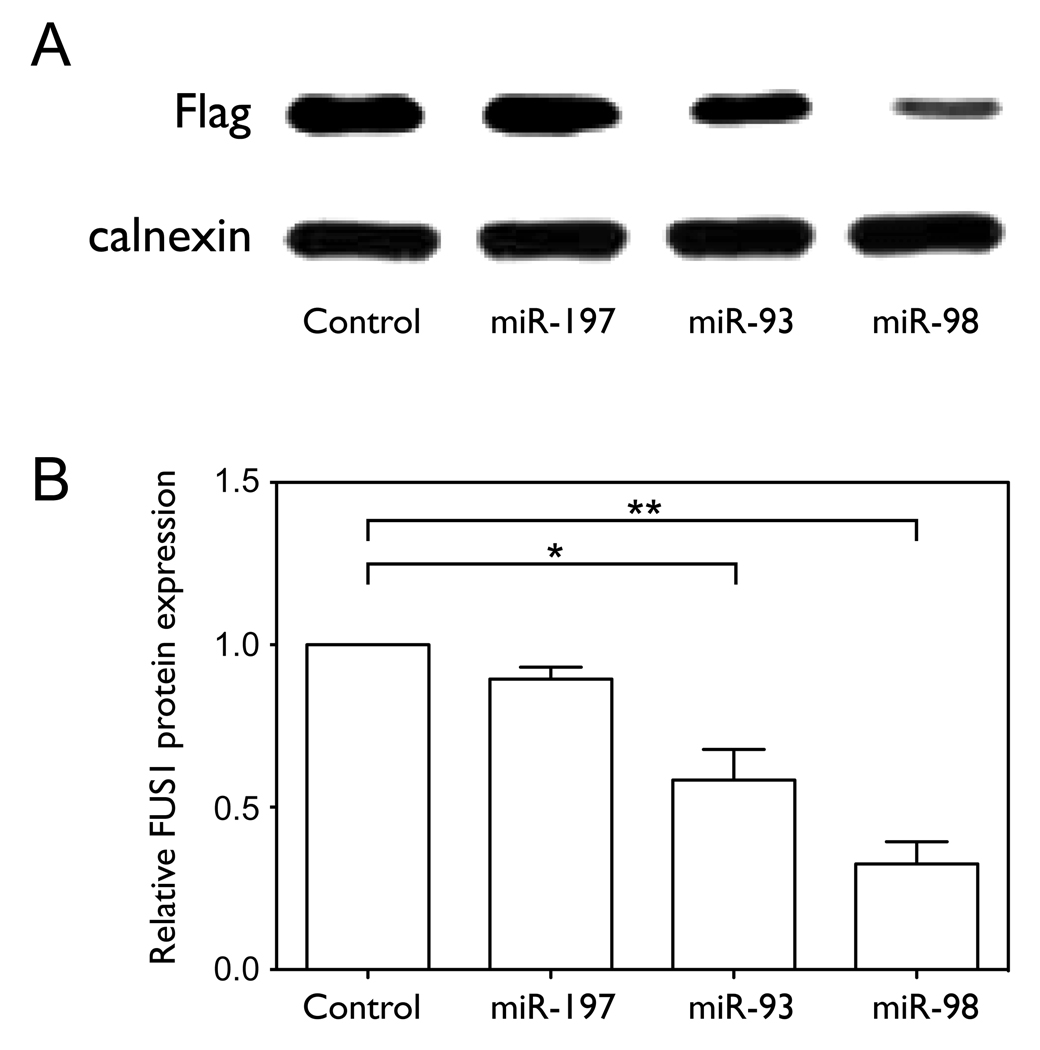
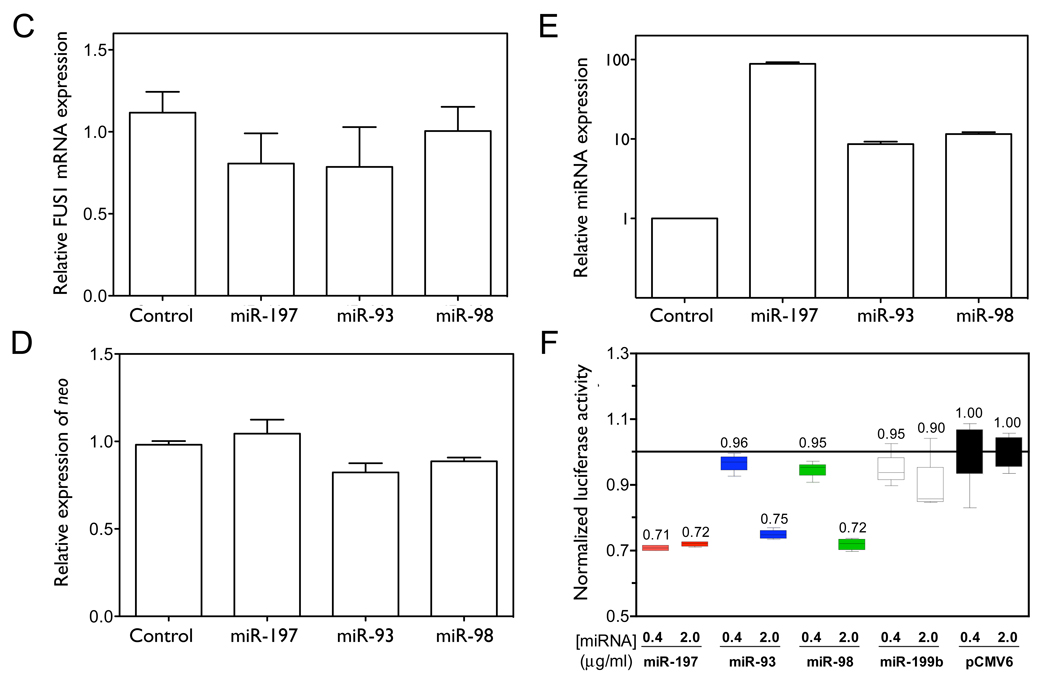
Figure 3. miR-93, miR-98 and miR-197 translationally repress FUS1.
(A–D) NCI-H1299 cells were plated in 100 mm dishes and co-transfected with Flag-FUS1-3’UTR expression vector (2 µg) and either pCMV6 empty vector (control) or pCMV6/miRNA expression vectors (10 µg), respectively, using Lipofectamine 2000 transfection reagent. After 48 h cell lysates were harvested and total RNA was isolated. Fus1 expression levels (A, B) were measured by Western blot using an anti-Flag antibody. Calnexin levels were used as a loading control. Quantification results were from three independent experiments. Relative levels of FUS1 (C) and neo (D) mRNAs, as well as miRNA levels (E) were measured by qRT-PCR. (F) The 3’UTR of FUS1 was cloned into a reporter construct containing a luciferase cDNA under the control of a mammalian promoter/terminator system. HEK-293 cells were plated in 24-well plates and co-transfected with pMIR-REPORT/luciferase-FUS1 3’UTR (0.4 µg), pCMV6/miRNAs (0.4 µg or 2 µg) and pMIR-REPORT/β gal control expression constructs (0.8 µg) using FuGENE 6 Transfection Reagent. After 48 h of transfection, cells were lysed and luciferase and β-galactosidase activity were measured. Shown are normalized luciferase activity for miR-93, miR-98 and miR-197, with miR-199b and an empty vector (pCMV6) as negative controls. The concentrations are of the transfected miRNA expression vector, and are 1X and 5X relative to that of the transfected luciferase reporter construct. (*, p<0.05; **, p<0.01).


