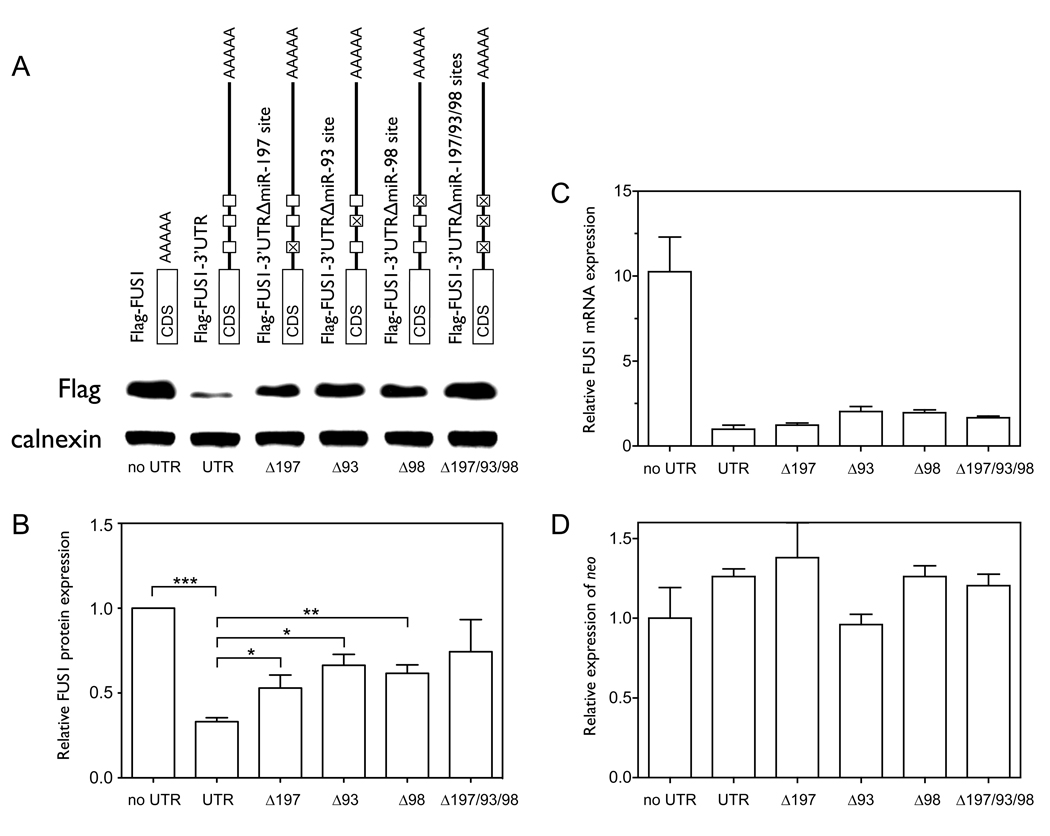
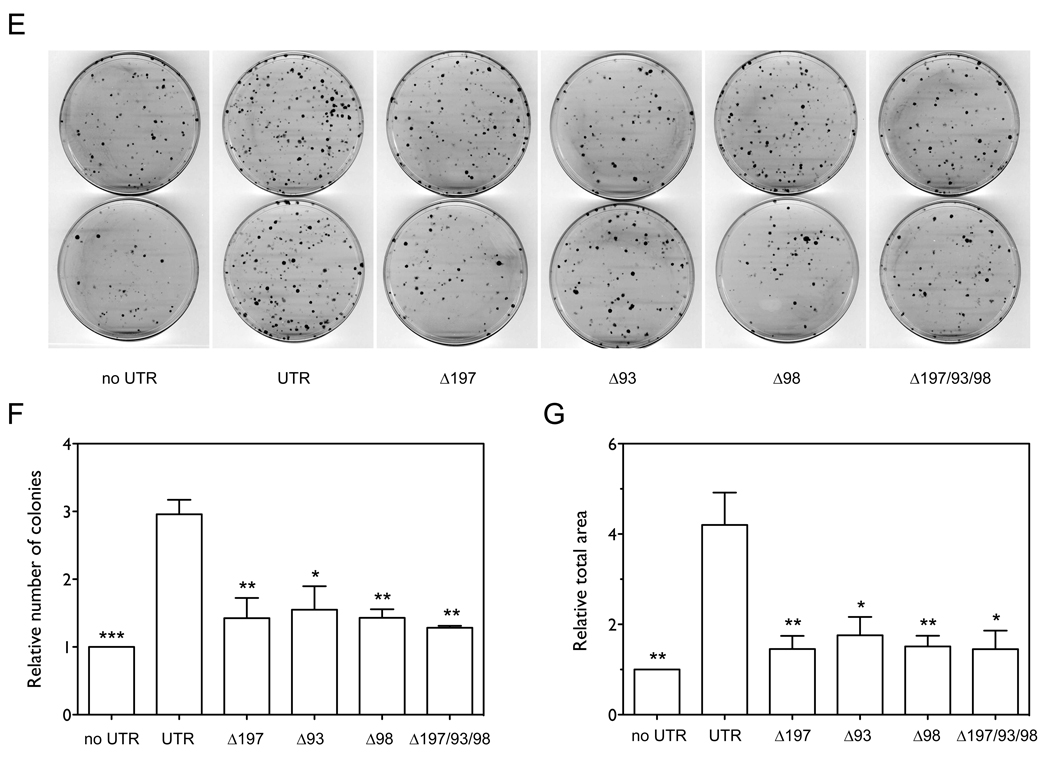
Figure 4. Deletion of the target sites of the three miRNAs restores Fus1 protein expression levels in NCI-H1299 cells.
NCI-H1299 cells were transfected with equal amounts (0.46 nM) of vectors expressing Flag-FUS1, wildtype Flag-FUS1-3’UTR and several mutated versions of Flag-FUS1-3’UTR, in which the seed sequences of the target sites in the FUS1 3’UTR are deleted, using Lipofectamine 2000 transfection reagent. After 48 h cell lysates were harvested and Fus1 expression levels (A,B) were measured by Western blot using an anti-Flag antibody. Calnexin levels were used as a loading control. The quantitation was generated from two independent transfections, each with two repeated Western blots. Relative levels of FUS1 mRNA (C) and neo mRNA (D) were measured by qRT-PCR. (E–G) Colony formation as a function of the Fus1 protein. NCI-H1299 cells were transfected with equal amounts (0.46 nM) of the above constructs. Colonies were visualized and quantified as described previously. (*, p<0.05; **, p<0.01; ***, p<0.001).


