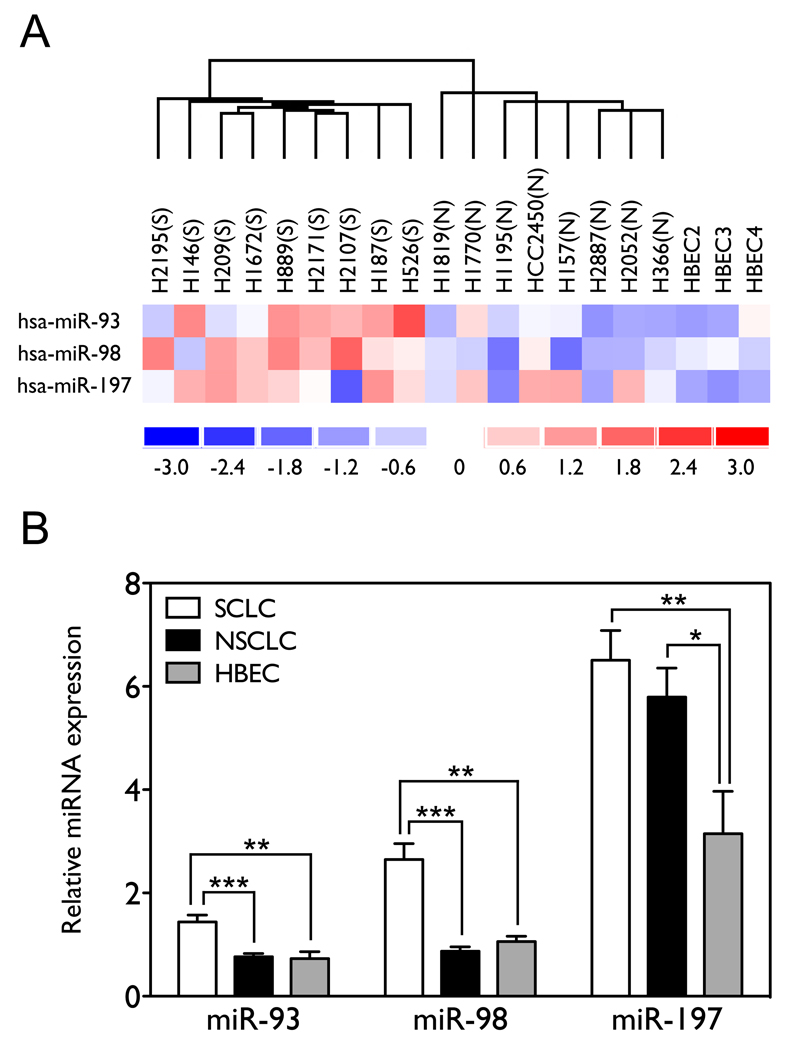
Figure 5. miR-93, miR-98 and miR-197 are differentially expressed among SCLC, NSCLC, and HBEC cell lines.
(A) Expression levels of miR-93, miR-98 and miR-197 across the panel of cell lines. The expression levels have been normalized by subtracting the mean expression and dividing by the standard deviation. Red represents miRNAs that are over-expressed relative to the reference; blue represents miRNAs that are under-expressed. (B) The mean expression levels of miR-93, miR-98 and miR-197 by group. Significance was assessed by two-tailed t-test. SCLC and (S), small-cell lung cancer; NSCLC and (N), non-small-cell lung cancer. (*, p<0.05; **, p<0.01; ***, p<0.001).

