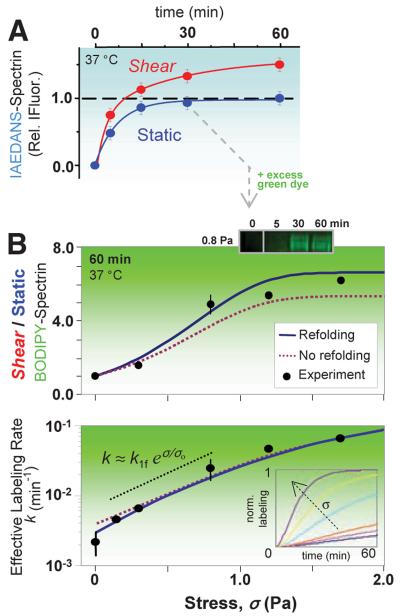
Fig. 3.
Stress-dependent kinetics and sequential two-dye labeling for amplification. (A) Sheared (σ = 0.93 Pa) versus static RBCs show distinct labeling kinetics for spectrin. IAEDANS labeling (at 2.5 mM) of the static-labeled, surface-exposed spectrin sites fit a first-order rate of 0.13 min-1; the shear-exposed sites (66% more from fit) label more slowly at 0.04 min-1. (B) Sequential labeling entails labeling of the surface Cys (blue) for 30 min, after which BODIPY-IA (green) is added at >10-fold excess (6 mM). Half of the cells are then exposed to shear with timed aliquots again quenched by IAM and analyzed by densitometry of the green fluorescent spectrin. BODIPY-spectrin at 60 min increases with σ (top) as does the effective rate of labeling (bottom). Error bars (±SD) indicate three or more measurements (six for σ = 0). The data are fit by the exact solution of the fLL reaction for P(t), either with or without refolding (SOM text). The intermediate regime of stress (dotted black line) is dominated by unfolding and increases exponentially with stress, exhibiting a characteristic stress of σo ≈ 0.5 Pa and giving k1f ≈ 0.004 min-1. (Inset) The effect of force on computed kinetics using the fit parameters.

