
Figure 4. Effects of RS domain cleavage site position on phosphorylation initiation.
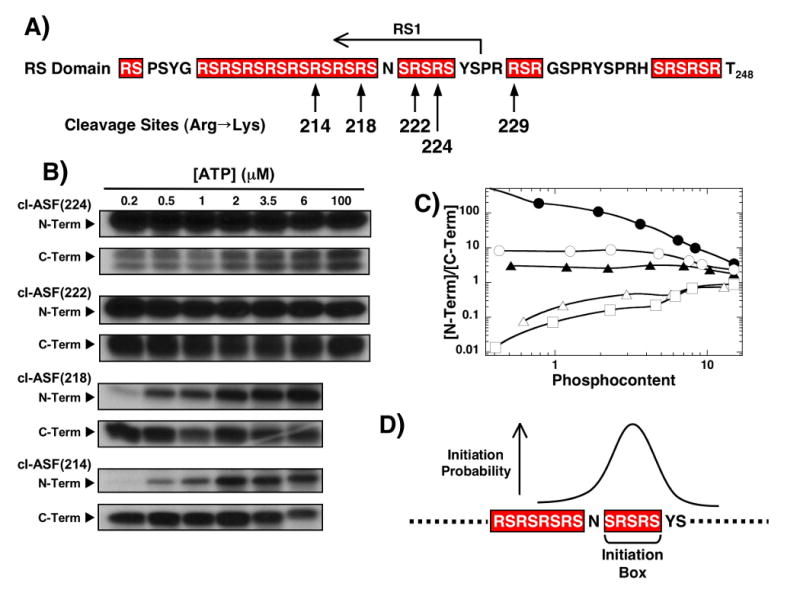
A) Cleavage sites. Alternate cleavage sites in the RS domain are made within the ASF/SF2 cleavage vector containing five Lys-to-Arg mutants in RRM2. B) ATP limitations studies. Complexes of SRPK1 (1 μM) and the cleavage mutants (250 nM) are reacted with varying amounts of 32P-ATP before the N- and C-terminal fragments are resolved by SDS-PAGE. C) N/C plot. Ratio of 32P in the N- and C-terminal fragments are plotted against the total phosphoryl content for cl-ASF(229) (●), cl-ASF(224) (○), cl-ASF(222) (▲), cl-ASF(218) (△) and cl-ASF(214) (□). Data for cl-ASF(229) are taken from Fig.3C. D) Initiation box. N- and C-terminal phosphorylation preferences at low ATP are used to establish the probable start region for SRPK1.