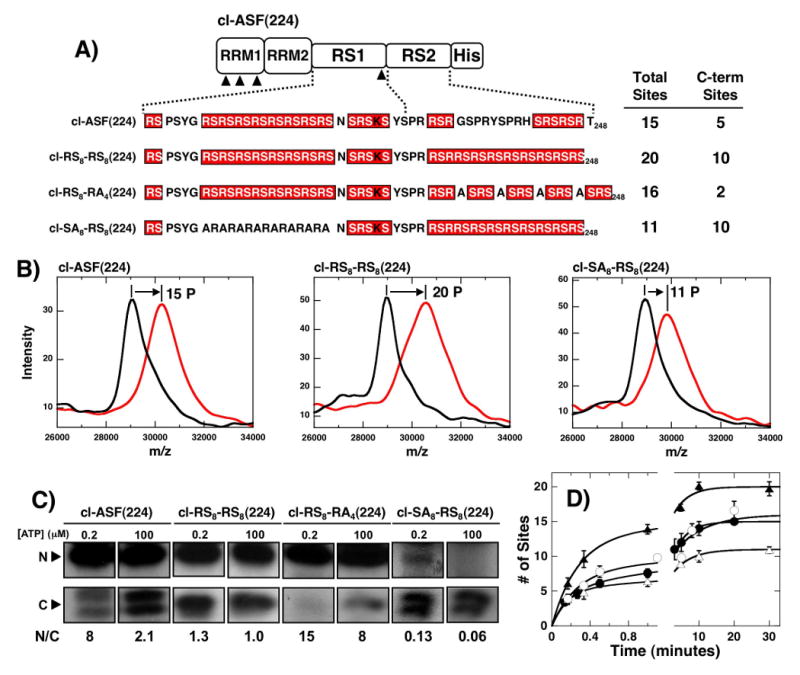
Figure 7. Effects of altering RS/SR content on RS2 phosphorylation.

A) Mutations in RS2. Mutations in RS2 segment are made in context of the parent construct cl-ASF(224). MALDI-TOF analyses of the total phosphoryl contents of each mutant are displayed along with estimates of the phosphoryl contents of the C-terminal fragments based on LysC treatment (see panel C). B) MALDI-TOF spectra. Mass spectrometric data were recorded for cl-ASF(224), cl-RS8-RS8(224) and cl-SA8-RS8(224) in the presence of SRPK1 and in the absence (black) and presence (red) of ATP. C) ATP limitation experiments. Complexes of SRPK1 (1 μM) and mutants (250 nM) are phosphorylated for 20 min using 0.2 and 100 μM 32P-ATP, cleaved with LysC and separated on SDS-PAGE. N/C ratios at each ATP are shown. D) Single turnover kinetic analyses. Complexes of 1μM SRPK1 and 250 nM cl-ASF(224) (●), cl-RS8-RS8(224) (▲), cl-RS8-RA4(224) (○) and cl-SA8-RS8(224) (△) are reacted with 100 μM 32P-ATP, quenched with SDS loading buffer and the total phosphoryl contents are plotted as a function of time. Amplitude and rate constants for the initial phases are 5.5 ± 0.48 and 5.4 ± 1.0 min-1 for cl-ASF(224), 12 ± 1.2 and 3.7 ± 0.7 min-1 for cl-RS8-RS8(224), 8.2 ± 1.9 and 3.8 ± 1.9 min-1 for cl-RS8-RA4(224) and 5.3 ± 0.31 and 6.3 ± 0.93 min-1 for cl-SA8-RS8(224), respectively. All progress curves are performed in triplicate and the error bars for each time point are displayed.
