Figure 6.
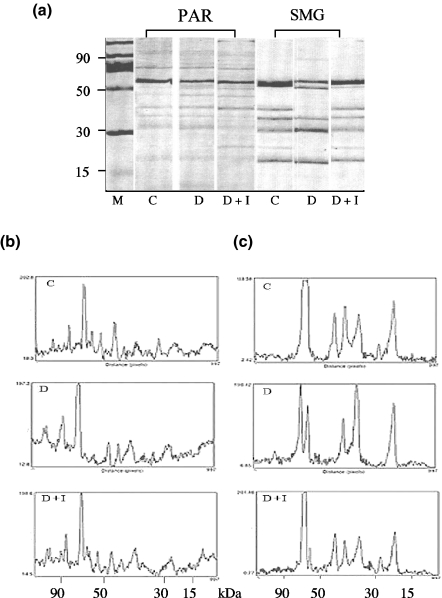
Electrophoretic banding patterns and densitometric analysis of salivary gland tissue. Panel (a) shows the electrophoretic protein banding patterns of SMG and parotid gland (PAR) tissue extracts. Identical protein amounts were loaded per lane and molecular size in kDa was determined as a function of relative mobility, compared with markers shown in lane M. Panels (b and c) are densitometric patterns of tissue extracts from parotid and SMG respectively. Peak height is representative of relative density measured in arbitrary units and shown on the ordinate of panels (b and c). Tissues from control, diabetic and diabetic reconstituted with insulin are labelled C, D and D + I respectively.

