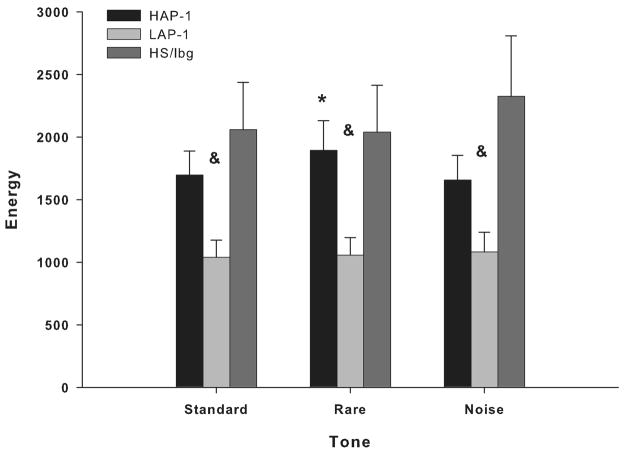
Figure 6.
Mean amplitude values of ERO energy for theta bands in response to standard, rare and noise stimuli in the frontal cortex. LAP-1 mice showed lower ERO energy than HAP-1 mice in the 350–800 ms time window in the theta band in response to rare tones. LAP-1 mice showed lower ERO energy than HS/Ibg mice in response to standard, rare and noise tones. * = Significant differences between HAP-1 and LAP-1 mice (P < 0.05). & = Significant differences between HS/Ibg and LAP-1 mice (P < 0.05).

