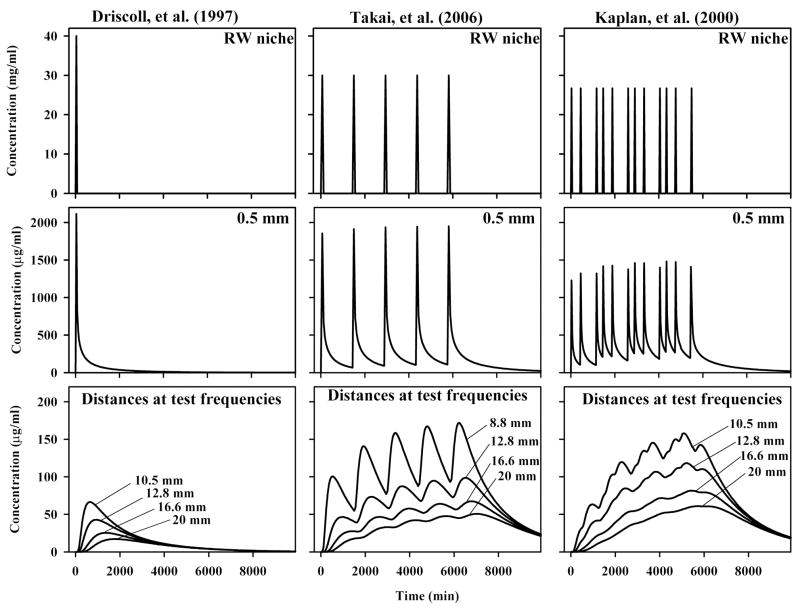
Figure 2.
Calculated gentamicin dosing for 3 protocols, specifically a single injection (Driscoll et al.12), daily injections (Takei et al.28) and 3 times daily injections (Kaplan et al.22). In each case, the dose applied to the RW niche is given (top row) and the level produced in the basal turn of scala tympani near the RW membrane, 0.5 mm from the base (middle row). The bottom row shows concentration time courses at the cochlear locations corresponding to the frequencies tested, which are (with distances from the base of ST shown in parentheses): 4000 Hz (8.8 mm), 3000 Hz (10.5 mm), 2000 Hz (12.8 mm), 1000 Hz (16.6 mm), 500 Hz (20 mm). Cmax and AUC were calculated for each of the four curves and the four values were averaged for comparison with hearing sensitivity changes. For the repeated application protocols there is little accumulation of drug in the basal turn (0.5 mm), but there is a pronounced cumulative effect for cochlear locations more distant (10 – 20 mm) from the application site.

