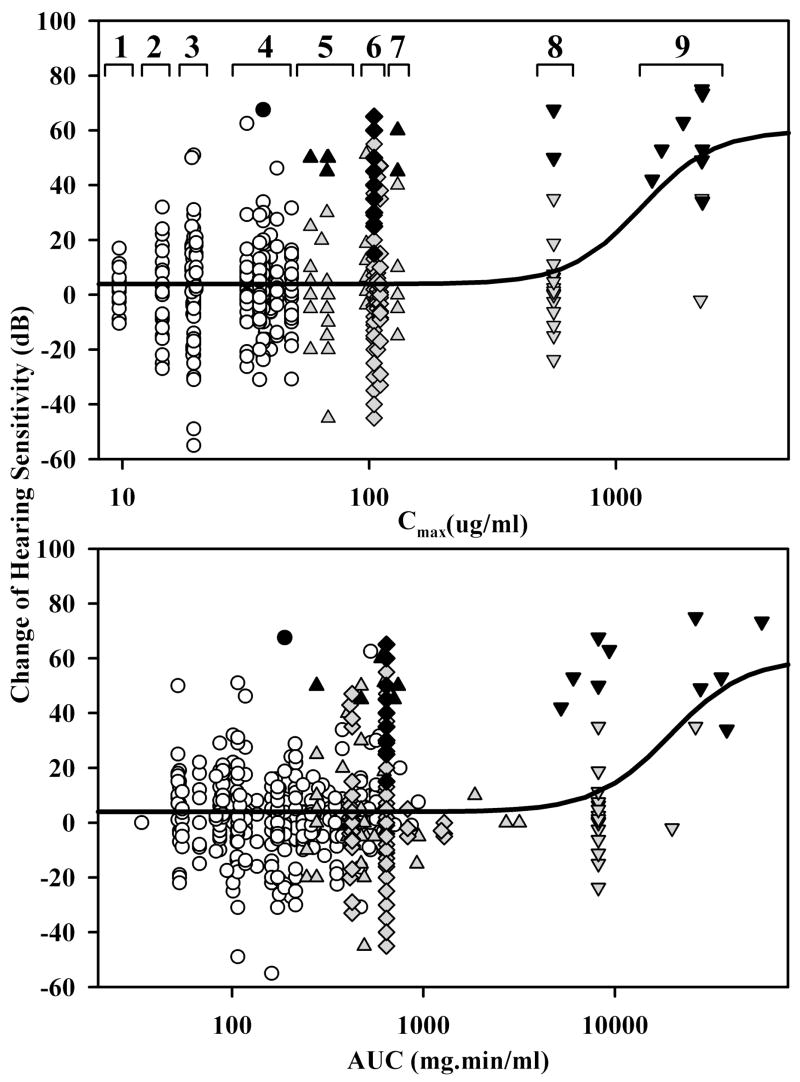
Figure 4.
Dependence of reported hearing sensitivity changes on the calculated gentamicin dose at the locations along scala tympani corresponding to the auditory frequencies tested. Dose was quantified either as the maximum concentration (Cmax: upper plot) or as the area under the curve (AUC: lower plot) averaged for specific locations in each study. The symbols represent the four delivery protocols depicted in Figure 3 (circles: one-shot; triangles: one or two times daily; diamonds: 3 times daily; inverted trangles: continuous). Open circles highlight the one shot protocol, while multiple injection (diamonds, triangles) and continuous protocols (inverted triangles) are shown shaded. Solid black symbols indicate patients who were deaf after the gentamicin treatment. Details of the fitted Hill functions are given in the text. In the calculation of Cmax, the studies from Table 1 within each of the numbered groups were 1: M; 2: C; 3: I, K, P; 4: B, H, J, O, S; 5: D, E; 6: A, F, G, L, R; 7: E; 8: Q; 9: N.

