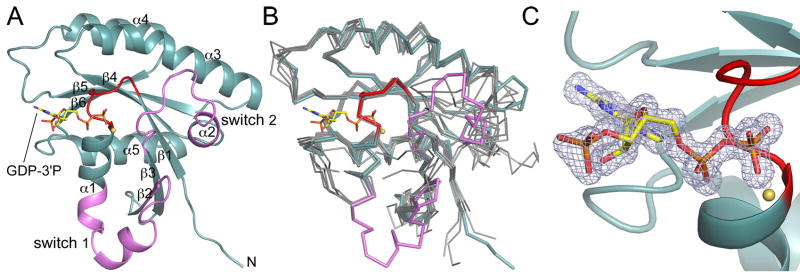
Fig. 1.
Structure of Rab28 with bound GDP-3′P. (A) Ribbon representation of the structure of GDP-3′P-Rab28, showing the switch region (defined as the region that changes conformation between the two structures determined here) in pink and the P-loop in red. The β-strands and α-helices are numbered according to their order in the sequence. (B) Superimposition of the structure of GDP-3′P-Rab28 (colored as in part A) with a representative group of inactive structures of Rab GTPases (gray) for which the active structures are also known (m-Rab5C, h-Rab7A, r-Rab7A, h-Rab11A, h-Rab11B, h-Rab21, Sc-Sec4, and Sc-Ypt7). The references and PDB codes of these structures are listed in Supplementary Table 1. (C) Close-up view of the catalytic site, showing a 2Fo-Fc omit electron density map (contoured at 1.4 σ) around the GDP-3′P nucleotide.

