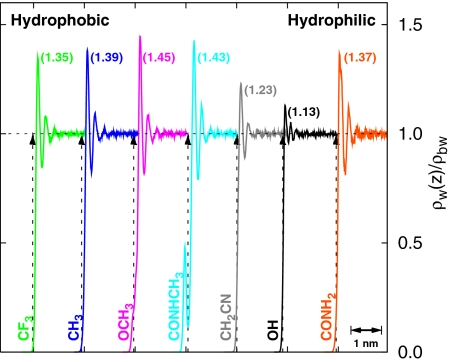
Fig. 2.
Water density near various surfaces. Mass density of water normal to the surface divided by its bulk value. The profiles are shifted horizontally for clarity. The vertical dashed lines with arrows indicate the location of intersection of surfactant and water-density profiles. The height of the first peak is indicated near the peak location.

