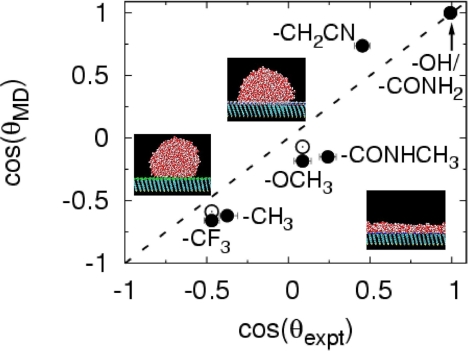
Fig. 3.
Characterizing wetting of interfaces. Comparison of cos(θ) measured in our simulations (21) and in experiments (36). Snapshots of water droplets on nonwetting (−CF3), partially wetting (−CONHCH3), and wetting (−OH) SAMs are shown. Filled circles are for nanodroplets with diameter ≈5 nm (2,176 molecules); open circles are extrapolations to the macroscopic limit from drop-size-dependent simulations.

