Fig. 1.
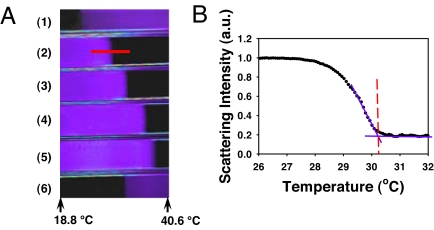
(A) A dark field image from a linear array of 6 microcapillary tubes. Channels 1 and 6 were filled with polymer solutions and used as standards to calibrate the temperature gradient. Channels 2 through 5 were filled with 90.4 mg/mL lysozyme solutions at pH 9.4 with 0.10, 0.12, 0.14, and 0.16 M NaSCN, respectively. (B) A light scattering intensity curve taken from the lysozyme solution containing 0.10 M NaSCN. The cloud-point temperature was determined by drawing straight purple lines through the data during the transition and above the transition. The intersection of these lines is denoted by a dashed red vertical line, which is taken to be the cloud-point temperature. The region of the fluorescence micrograph that was used to obtain this linescan is denoted with a red line in A.

