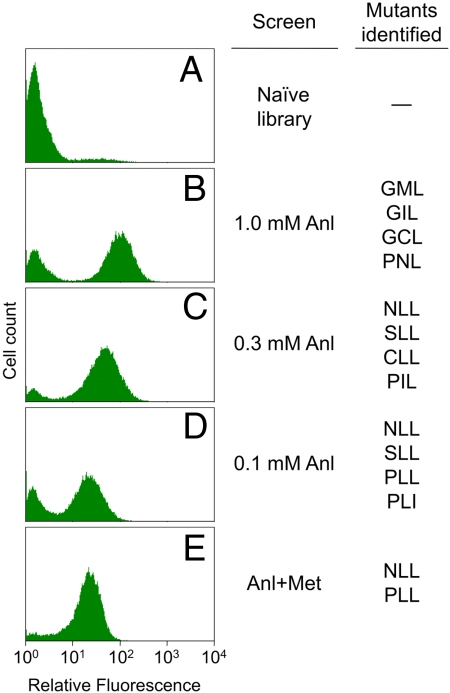
Fig. 3.
Fluorescence histograms of the naïve library and populations enriched in fluorescent clones. The naïve library (A) is shown labeled at 1.0 mM Anl. Populations enriched through two rounds of screening at 1.0 mM Anl (B), 0.3 mM Anl (C), or 0.1 mM Anl (D) are displayed next to MetRS mutants identified by these screens. The Anl+Met screen was performed at 1.0 mM Anl over three rounds, increasing the Met concentration from 0.01 mM to 0.03 mM to 0.1 mM. The final population from this screen (E) is shown after labeling at equal concentrations (1.0 mM) of Anl and Met.

