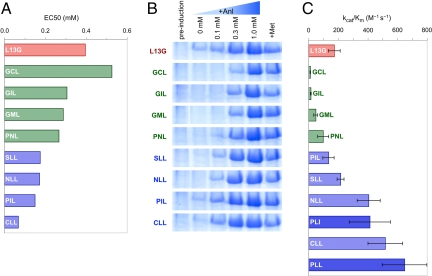
Fig. 4.
Comparison of in vivo and in vitro activities of the identified MetRS mutants. Data shown for mutants identified by screens at 1.0 mM and 0.3 mM Anl, and the L13G mutant are marked in green, blue, and red, respectively. Protein expression, cell-surface labeling in vivo and Anl activation in vitro are consistent in indicating better activity for mutants screened at lower Anl concentrations. (A) EC50 values describing the fluorescence response to Anl availability in the expression media. (B) SDS/PAGE analysis of whole-cell lysates for cells expressing mDHFR under different conditions. Cells grown to midlog phase in medium containing all 20 canonical amino acids were then shifted into 19-amino acid medium (no Met) supplemented with 0.1, 0.3, or 1.0 mM Anl (lanes 3, 4, and 5, respectively), 40 mg/L Met (lane 6), or no 20th amino acid (lane 2) before induction of mDHFR synthesis. Lane 1 shows cells before induction. For clear presentation images were resized and lanes on the GML panel were reordered. Original images can be found in Fig. S3. (C) Specificity constants (kcat/Km) for Anl activation measured in vitro. Average of three measurements is reported with errors bars indicating one standard deviation. Data for mutants identified by the 0.1 mM Anl screen (PLL and PLI) are shown in dark blue.

