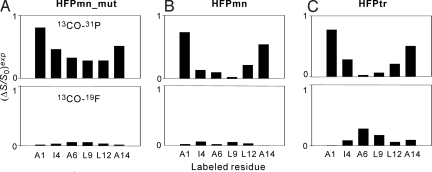
Fig. 2.
Summary of experimental REDOR dephasing (ΔS/S0)exp for the spectra displayed in Fig. 1. The top box in each image is the 13CO-31P data and the bottom box is the 13CO-(16-19F) data. The (ΔS/S0)exp values are shown as bars and a typical uncertainty is ±0.04.

