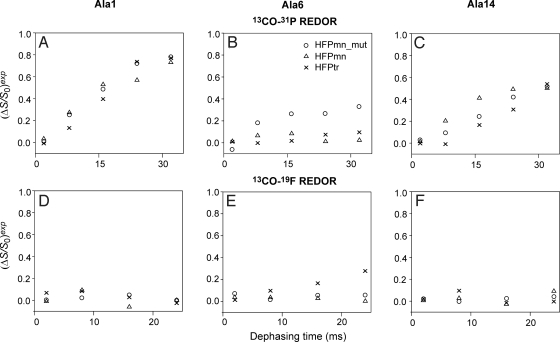
Fig. 4.
13CO-31P and 13CO-19F REDOR dephasing curves for different samples containing 16-19F-DPPC lipid and labeled at (A and D) Ala-1, (B and E) Ala-6 or (C and F) Ala-14. The symbol for each construct is given in the legend of B. For 2 ms dephasing time, the typical uncertainty in (ΔS/S0)exp is ±0.02 and for the other dephasing times, the typical uncertainty is ±0.04.

