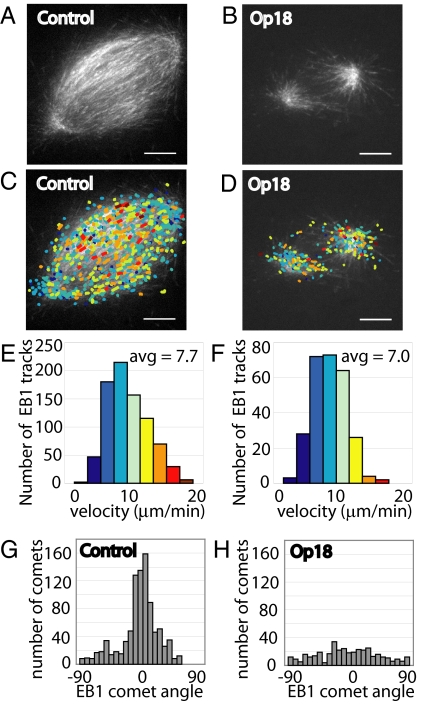
Fig. 2.
Microtubule polymerization rates are not affected upon treatment with 15 μM Op18. (A) Control spindle labeled with 0.013 mg/mL (≈0.5 μM) Alexa488-labeled recombinant EB1, imaged by confocal microscopy. (B) Spindle treated with 15 μM Op18, labeled with Alexa488-EB1, and imaged as in panel A. (C) EB1 comets from time-lapse sequence of control spindle in panel A were detected and tracked using automated software. Tracks were colored to reflect velocity, with blue colors being slower than red colors (see histogram in Fig. 2E). Colored EB1 tracks were overlaid onto a single frame from the control spindle time-lapse. (D) EB1 comet tracking was performed as in panel C for the Op18-treated spindle, and EB1 were tracks overlaid onto a single EB1 frame. (E) Histogram of EB1 track velocities detected in the control spindle. Average EB1 track velocity for the control spindle shown = 7.7 μm/min, average velocity of multiple control spindles = 8.0 μm/min (n = 6). (F) Histogram of EB1 track velocities detected in spindle treated with 15 μM Op18. Average EB1 track velocity for the Op18-treated spindle shown = 7.0 μm/min, average velocity of multple Op18 treated spindles = 7.3 μm/min (n = 4). (G) Angle distribution histogram for EB1 comets detected in C. (H) Angle distribution histogram for EB1 comets detected in D. (Scale bar: 10 μm.)

