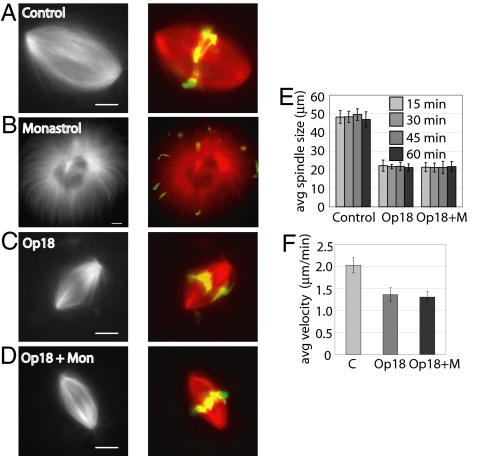
Fig. 5.
Spindles depleted of barrel-array microtubules maintain bipolarity upon kinesin-5 inhibition. (A–D) Spindles were labeled with 0.2 μM X-rhodamine tubulin and treated with DMSO control (A), 100 μM monastrol for 40 min (B), 15 μM Op18 for 40 min (C), or 15 μM Op18 for 10 min, followed by 100 μM monastrol for 30 min (D). Widefield images of labeled tubulin in black and white (Left). Merged widefield images of tubulin (red) and DNA (green) (Right). (E) Bar graph of average spindle length, measured as pole-to-pole distance, of fixed spindles at indicated time points treated with DMSO, 15 μM Op18, or 15 μM Op18 and 100 μM monastrol. N = >30 spindles for each time point. Error bars represent one standard deviation. (F) Bar graph reporting the average velocity of speckles in control spindles (average speckle velocity = 2.03 μm/min, n = 5 spindles, SD = 0.17 μm/min), spindles treated with 15 μM Op18 (average speckle velocity = 1.36 μm/min, n = 12 spindles, SD = 0.16 μm/min), and spindles treated with 15 μM Op18 and 100 μM monastrol (average speckle velocity = 1.31 μm/min, n = 10 spindles, SD = 0.13 μm/min). Error bars represent one standard deviation between average velocities for all spindles in each condition. (Scale bar: 10 μm.)

